 Parks & Legends
Least Crowded National Parks (NPS Visitation Data, Ranked)
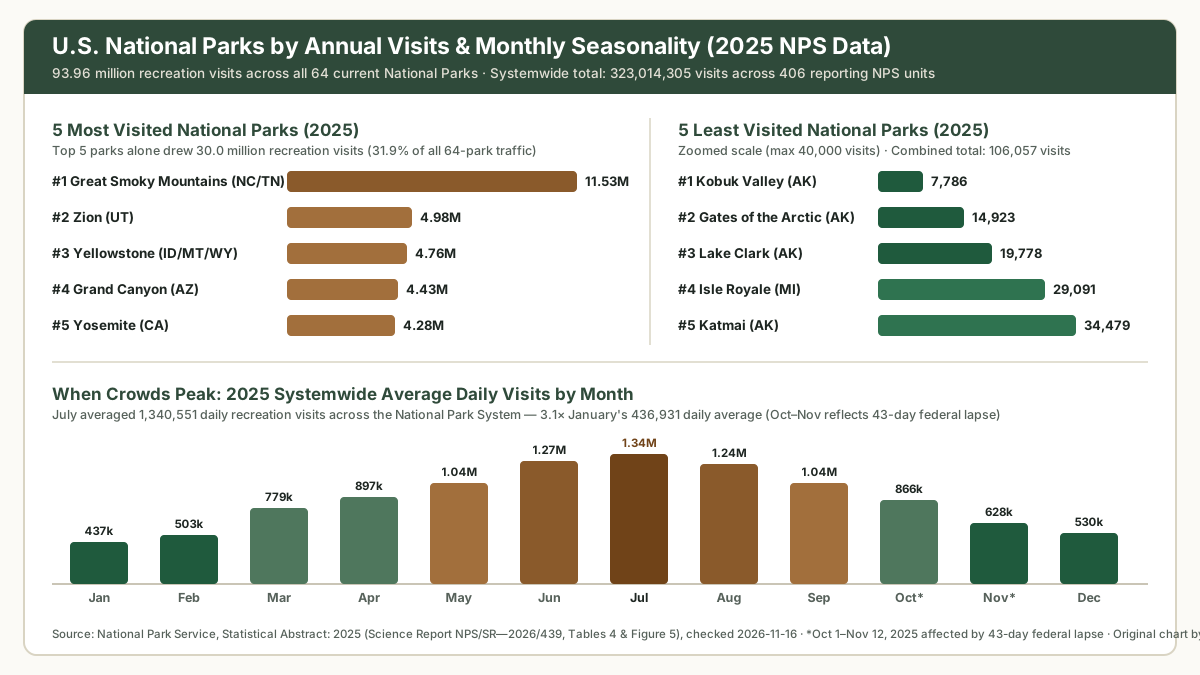
Short answer: 5 least visited and 5 most visited national parks (2025)
Looking for the least crowded national parks in the United States? According to the National Park Service’s Statistical Abstract: 2025 (Science Report NPS/SR—2026/439) and the March 13, 2026 NPS visitation release (last checked: 2026-11-16), the entire National Park System logged 323,014,305 recreation visits across 406 reporting units in 2025 (−2.7% from 2024’s record 331.86 million).
Within that total, America’s 64 congressionally designated National Parks accounted for 93,962,527 recreation visits (93,892,121 across the 63 parks designated in 2025, plus 70,406 at Chiricahua, which Congress elevated from a National Monument to the 64th National Park on October 20, 2026 per NPS Recent Changes). Traffic is heavily concentrated at the top: Great Smoky Mountains alone drew 1,481 times as many visits as Kobuk Valley.
- 5 Least Visited U.S. National Parks in 2025:
- Kobuk Valley National Park (AK) — 7,786 recreation visits
- Gates of the Arctic National Park & Preserve (AK) — 14,923 recreation visits (all-time park record)
- Lake Clark National Park & Preserve (AK) — 19,778 recreation visits
- Isle Royale National Park (MI) — 29,091 recreation visits (least visited in the Lower 48)
- Katmai National Park & Preserve (AK) — 34,479 recreation visits
- 5 Most Visited U.S. National Parks in 2025:
- Great Smoky Mountains National Park (NC, TN) — 11,527,939 recreation visits
- Zion National Park (UT) — 4,984,525 recreation visits
- Yellowstone National Park (ID, MT, WY) — 4,762,988 recreation visits
- Grand Canyon National Park (AZ) — 4,430,653 recreation visits
- Yosemite National Park (CA) — 4,278,413 recreation visits
Ranking: all 64 national parks by annual visits
Every figure in the sortable table below comes from Table 4 (recreation visits and year-over-year percent change) and Table 7 (total overnight stays) of the NPS Statistical Abstract: 2025. Although older lists stop at 63 parks, we include Chiricahua National Park (#8 least visited at 70,406 visits in 2025) with an explicit note that its 2025 traffic was recorded as Chiricahua National Monument prior to its October 20, 2026 redesignation (NPS Recent Changes).
Use the Quick rank order selector to flip between Least Visited First and Most Visited First, filter by region, or sort by overnight stays to spot parks where visitors camp rather than drive through.
Showing all 64 national parks sorted from least visited to most visited (2025 NPS data, checked 2026-11-16)
| Official Link | ||||||
|---|---|---|---|---|---|---|
| #1(#64 most) | Kobuk Valley National Park | AK | 7,786 | -54.8% | 1,646 | NPS (KOVA) |
| #2(#63 most) | Gates of the Arctic National Park and Preserve | AK | 14,923 | +25.3% | 4,477 | NPS (GAAR) |
| #3(#62 most) | Lake Clark National Park and Preserve | AK | 19,778 | +6.9% | 16,644 | NPS (LACL) |
| #4(#61 most) | Isle Royale National Park | MI | 29,091 | +1.0% | 63,179 | NPS (ISRO) |
| #5(#60 most) | Katmai National Park and Preserve | AK | 34,479 | -4.8% | 16,185 | NPS (KATM) |
| #6(#59 most) | National Park of American Samoa | AS | 43,258 | +91.7% | 0 | NPS (NPSA) |
| #7(#58 most) | North Cascades National Park | WA | 46,925 | +184.7% | 20,746 | NPS (NOCA) |
| #8(#57 most) | Chiricahua National ParkCounted as Chiricahua NM in 2025; redesignated NP Oct 20, 2026 | AZ | 70,406 | -1.4% | 20,337 | NPS (CHIR) |
| #9(#56 most) | Dry Tortugas National Park | FL | 89,355 | +5.3% | 16,347 | NPS (DRTO) |
| #10(#55 most) | Wrangell–St. Elias National Park and Preserve | AK | 108,840 | +33.3% | 24,347 | NPS (WRST) |
| #11(#54 most) | Great Basin National Park | NV | 161,210 | +6.0% | 38,362 | NPS (GRBA) |
| #12(#53 most) | Voyageurs National Park | MN | 206,326 | +3.7% | 71,544 | NPS (VOYA) |
| #13(#52 most) | Guadalupe Mountains National Park | TX | 206,423 | -8.7% | 32,363 | NPS (GUMO) |
| #14(#51 most) | Channel Islands National Park | CA | 227,186 | -13.5% | 109,058 | NPS (CHIS) |
| #15(#50 most) | Black Canyon of the Gunnison National Park | CO | 250,086 | -25.5% | 18,729 | NPS (BLCA) |
| #16(#49 most) | Congaree National Park | SC | 287,833 | +18.9% | 11,766 | NPS (CONG) |
| #17(#48 most) | Petrified Forest National Park | AZ | 315,951 | -43.5% | 816 | NPS (PEFO) |
| #18(#47 most) | Pinnacles National Park | CA | 343,208 | -3.1% | 113,197 | NPS (PINN) |
| #19(#46 most) | Carlsbad Caverns National Park | NM | 410,778 | -10.8% | 82 | NPS (CAVE) |
| #20(#45 most) | Kenai Fjords National Park | AK | 425,369 | +1.4% | 1,290 | NPS (KEFJ) |
| #21(#44 most) | Great Sand Dunes National Park and Preserve | CO | 432,498 | -1.2% | 77,143 | NPS (GRSA) |
| #22(#43 most) | Mesa Verde National Park | CO | 463,130 | -3.5% | 66,808 | NPS (MEVE) |
| #23(#42 most) | Virgin Islands National Park | VI | 471,074 | +11.4% | 42,962 | NPS (VIIS) |
| #24(#41 most) | Biscayne National Park | FL | 486,567 | -5.0% | 2,604 | NPS (BISC) |
| #25(#40 most) | Lassen Volcanic National Park | CA | 504,777 | +41.1% | 98,109 | NPS (LAVO) |
| #26(#39 most) | Denali National Park and Preserve | AK | 543,300 | +16.5% | 47,477 | NPS (DENA) |
| #27(#38 most) | Big Bend National Park | TX | 568,104 | +1.2% | 178,082 | NPS (BIBE) |
| #28(#37 most) | Wind Cave National Park | SD | 606,258 | +23.9% | 19,049 | NPS (WICA) |
| #29(#36 most) | Crater Lake National Park | OR | 632,242 | +25.2% | 53,599 | NPS (CRLA) |
| #30(#35 most) | White Sands National Park | NM | 659,742 | -6.1% | 0 | NPS (WHSA) |
| #31(#34 most) | Mammoth Cave National Park | KY | 660,734 | -11.6% | 84,662 | NPS (MACA) |
| #32(#33 most) | Theodore Roosevelt National Park | ND | 729,893 | -0.4% | 37,237 | NPS (THRO) |
| #33(#32 most) | Glacier Bay National Park and Preserve | AK | 740,044 | +0.5% | 36,018 | NPS (GLBA) |
| #34(#31 most) | Everglades National Park | FL | 778,198 | +4.9% | 80,041 | NPS (EVER) |
| #35(#30 most) | Kings Canyon National Park | CA | 779,791 | +11.5% | 179,361 | NPS (KICA) |
| #36(#29 most) | Canyonlands National Park | UT | 796,057 | -2.7% | 90,018 | NPS (CANY) |
| #37(#28 most) | Saguaro National Park | AZ | 847,749 | -10.4% | 2,464 | NPS (SAGU) |
| #38(#27 most) | Haleakalā National Park | HI | 853,711 | +16.6% | 28,005 | NPS (HALE) |
| #39(#26 most) | Badlands National Park | SD | 1,139,361 | +4.1% | 48,375 | NPS (BADL) |
| #40(#25 most) | Redwood National Park2025 reflects updated traffic-counter methodology | CA | 1,202,480 | +93.1% | 16,734 | NPS (REDW) |
| #41(#24 most) | Death Valley National Park | CA, NV | 1,320,134 | -8.4% | 190,301 | NPS (DEVA) |
| #42(#23 most) | Sequoia National Park | CA | 1,378,337 | +5.3% | 253,809 | NPS (SEQU) |
| #43(#22 most) | Capitol Reef National Park | UT | 1,388,476 | -2.4% | 55,005 | NPS (CARE) |
| #44(#21 most) | Arches National Park | UT | 1,511,740 | +3.1% | 49,118 | NPS (ARCH) |
| #45(#20 most) | Mount Rainier National Park | WA | 1,635,342 | +0.9% | 134,384 | NPS (MORA) |
| #46(#19 most) | Shenandoah National Park | VA | 1,682,152 | -2.2% | 247,526 | NPS (SHEN) |
| #47(#18 most) | Hawaiʻi Volcanoes National Park | HI | 1,877,854 | +31.0% | 110,587 | NPS (HAVO) |
| #48(#17 most) | New River Gorge National Park and Preserve | WV | 1,958,440 | +8.1% | 42,857 | NPS (NERI) |
| #49(#16 most) | Bryce Canyon National Park2025 reflects shuttle-count methodology correction | UT | 1,967,367 | -21.2% | 153,740 | NPS (BRCA) |
| #50(#15 most) | Gateway Arch National Park | MO | 2,209,028 | -13.8% | 0 | NPS (JEFF) |
| #51(#14 most) | Hot Springs National Park | AR | 2,494,611 | +1.3% | 34,240 | NPS (HOSP) |
| #52(#13 most) | Indiana Dunes National Park | IN | 2,629,497 | -2.8% | 39,319 | NPS (INDU) |
| #53(#12 most) | Joshua Tree National Park | CA | 2,932,644 | -2.0% | 325,052 | NPS (JOTR) |
| #54(#11 most) | Cuyahoga Valley National Park | OH | 3,025,325 | +3.9% | 3,329 | NPS (CUVA) |
| #55(#10 most) | Glacier National Park | MT | 3,136,557 | -2.3% | 390,524 | NPS (GLAC) |
| #56(#9 most) | Olympic National Park | WA | 3,584,187 | -3.6% | 426,748 | NPS (OLYM) |
| #57(#8 most) | Grand Teton National Park | WY | 3,800,648 | +4.8% | 631,366 | NPS (GRTE) |
| #58(#7 most) | Acadia National Park | ME | 4,079,318 | +3.0% | 196,459 | NPS (ACAD) |
| #59(#6 most) | Rocky Mountain National Park | CO | 4,171,431 | +0.4% | 190,231 | NPS (ROMO) |
| #60(#5 most) | Yosemite National Park | CA | 4,278,413 | +3.8% | 1,528,346 | NPS (YOSE) |
| #61(#4 most) | Grand Canyon National Park | AZ | 4,430,653 | -9.9% | 961,440 | NPS (GRCA) |
| #62(#3 most) | Yellowstone National Park | ID, MT, WY | 4,762,988 | +0.4% | 1,238,983 | NPS (YELL) |
| #63(#2 most) | Zion National Park | UT | 4,984,525 | +0.8% | 286,122 | NPS (ZION) |
| #64(#1 most) | Great Smoky Mountains National Park | NC, TN | 11,527,939 | -5.4% | 448,800 | NPS (GRSM) |
Source: National Park Service, Statistical Abstract: 2025 (Science Report NPS/SR—2026/439, Tables 4 & 7), checked 2026-11-16. Each row's underlying JSON record carries source and checked: "2026-11-16".
Most visited national parks in 2025 (Top 10)
The Top 10 national parks drew 48,766,659 recreation visits in 2025—51.9% of all visits across the 64 parks combined (NPS Statistical Abstract: 2025, Table 5):
| 2025 Rank | National Park | State(s) | 2025 Visits | vs. 2024 | 2025 Overnight Stays |
|---|---|---|---|---|---|
| 1 | Great Smoky Mountains | NC, TN | 11,527,939 | −5.4% | 448,800 |
| 2 | Zion | UT | 4,984,525 | +0.8% | 286,122 |
| 3 | Yellowstone | ID, MT, WY | 4,762,988 | +0.4% | 1,238,983 |
| 4 | Grand Canyon | AZ | 4,430,653 | −9.9% | 961,440 |
| 5 | Yosemite | CA | 4,278,413 | +3.8% | 1,528,346 |
| 6 | Rocky Mountain | CO | 4,171,431 | +0.4% | 190,231 |
| 7 | Acadia | ME | 4,079,318 | +3.0% | 196,459 |
| 8 | Grand Teton | WY | 3,800,648 | +4.8% | 631,366 |
| 9 | Olympic | WA | 3,584,187 | −3.6% | 426,748 |
| 10 | Glacier | MT | 3,136,557 | −2.3% | 390,524 |
Three documented events shaped the 2025 numbers (NPS Statistical Abstract: 2025, p. 1 & Endnotes; NPS March 13, 2026 Release):
- The 43-day partial federal government shutdown (October 1 – November 12, 2025): The longest lapse in federal appropriations in U.S. history closed or curtailed visitor centers, gated parks, and automated counters during peak fall foliage season, trimming autumn totals nationwide.
- Major wildfire and storm closures: The Dragon Bravo Fire closed Grand Canyon’s North Rim from July 10 through September 2025, coinciding with Grand Canyon’s −9.9% drop and its slip behind Yellowstone from #3 in 2024 to #4 in 2025 (Zion already outpaced Grand Canyon in 2024). In Colorado, the South Rim Fire closed sections of Black Canyon of the Gunnison (−25.5%), while post-Hurricane Helene road repairs continued in Great Smoky Mountains corridors.
- Record-setting parks: Even with the fall lapse, 26 NPS units set all-time annual visitation records in 2025, including 9 designated National Parks: Congaree (287,833), Dry Tortugas (89,355), Gates of the Arctic (14,923), Glacier Bay (740,044), Kenai Fjords (425,369), New River Gorge (1,958,440), Redwood (1,202,480), Sequoia (1,378,337), and Wrangell–St. Elias (108,840).
Least visited, but worth the trip: 7 low-crowd parks and how to reach them
Four of the five least visited parks—Kobuk Valley (7,786), Gates of the Arctic (14,923), Lake Clark (19,778), and Katmai (34,479)—are roadless Alaskan wildernesses requiring chartered air taxis or floatplanes. If you want genuine quiet without chartering a bush plane in the Arctic, these 7 low-visitation Lower 48 parks deliver dramatic scenery and manageable logistics:
- Isle Royale National Park, Michigan (
29,091visits · #4 least visited): A roadless Lake Superior archipelago where visitors stay longer than almost anywhere else in the park system—logging 63,179 overnight stays across just 29,091 arrivals (NPS 2025 Abstract). Reach it by seasonal passenger ferry or seaplane from Houghton or Copper Harbor (MI) or Grand Portage (MN) between April 16 and October 31 (NPS Isle Royale Basic Info). - North Cascades National Park, Washington (
46,925visits · #7 least visited): Just three hours northeast of Seattle, yet ranked in the bottom 10 because scenic State Route 20 actually runs through adjacent Ross Lake National Recreation Area; crossing into the designated National Park unit requires hiking alpine passes, driving rough Cascade River Road toward Cascade Pass, or riding the passenger ferry up Lake Chelan to roadless Stehekin ($0 entrance; NPS North Cascades Basic Info). - Chiricahua National Park, Arizona (
70,406visits · #8 least visited): Redesignated in October 2026 (NPS Recent Changes), this forested “sky island” in southeastern Arizona features an 8-mile paved scenic drive to Massai Point and 17 miles of trails winding through towering volcanic rhyolite pinnacles—reachable by regular passenger car with a $0 entrance fee (NPS Chiricahua Basic Info). - Dry Tortugas National Park, Florida (
89,355visits · #9 least visited): Roughly 70 miles west of Key West across open turquoise water, combining massive 19th-century brick Fort Jefferson with shallow coral reefs for beginner-friendly snorkeling. Daily headcounts are naturally capped by seating on the Yankee Freedom high-speed ferry, authorized seaplanes, and private boats (NPS Dry Tortugas Basic Info). - Great Basin National Park, Nevada (
161,210visits · #11 least visited): One of the quietest drive-right-in parks in the American West, off U.S. Highway 50 near Baker, Nevada. Paved Wheeler Peak Scenic Drive climbs above 10,000 feet to ancient bristlecone pines thousands of years old, Nevada’s only glacier remnant, dark night skies, and ranger-led Lehman Caves tours ($0 park entrance; NPS Great Basin Basic Info). - Guadalupe Mountains National Park, Texas (
206,423visits · #13 least visited): Thirty-five miles southwest of Carlsbad Caverns on U.S. 62/180, protecting a fossilized Permian limestone reef, 8,751-foot Guadalupe Peak (the highest point in Texas), and autumn bigtooth maple color inside McKittrick Canyon (NPS Guadalupe Mountains Basic Info). - Channel Islands National Park, California (
227,186visits · #14 least visited): Five undeveloped islands off Southern California with sea caves, endemic island foxes, and zero cars or hotels—reachable on 1- to 4-hour boat crossings from Ventura or Oxnard harbors via Island Packers or plane flights to Santa Rosa Island ($0 park entrance; NPS Channel Islands Basic Info).
Quiet months at the busy parks: what 2025 NPS monthly data shows
Low annual visitation is not the only way to avoid crowds—timing matters just as much. Across the entire National Park System in 2025, July averaged 1,340,551 recreation visits per day, more than three times January’s daily average of 436,931 (NPS Statistical Abstract: 2025, Figure 5, p. 27):
| Month (2025) | Systemwide Avg. Daily Visits | Share vs. July Peak | Seasonal Context |
|---|---|---|---|
| January | 436,931 | 32.6% | Lowest daily volume systemwide; prime season in Florida & desert parks |
| February | 502,736 | 37.5% | Quiet everywhere except Presidents’ Day weekend in southern/desert parks |
| March | 779,007 | 58.1% | Spring break surge begins at Southwest canyons (Zion triples Feb volume) |
| April | 897,338 | 66.9% | Desert wildflower & Utah Mighty 5 shoulder season; high mountain roads still snowed in |
| May | 1,044,638 | 77.9% | Memorial Day launches peak summer season; snowmelt peaks on western rivers |
| June | 1,272,453 | 94.9% | School vacations open; alpine roads finish plowing at Glacier, Rainier & Rocky Mtn |
| July | 1,340,551 | 100.0% (Peak) | Highest daily visitation across the NPS; Alaska & high-mountain window |
| August | 1,236,224 | 92.2% | Heavy summer family travel; Southwest monsoon thunderstorms |
| September | 1,043,328 | 77.8% | Post-Labor Day dip on weekdays, followed by Rocky Mountain & northern fall color |
| October* | 865,512 | 64.6% | *Depressed in 2025 by federal lapse (Oct 1–31); normally major foliage month at Smokies, Acadia & Zion |
| November* | 627,814 | 46.8% | *Lapse ended Nov 12, 2025; quiet outside Thanksgiving week |
| December | 529,621 | 39.5% | Quiet first three weeks; sharp spike Dec 26–Jan 1 |
(Note: Individual park-by-month tables on IRMA’s legacy report viewer were unavailable at check time on 2026-11-16, so we report only published systemwide daily averages from Figure 5 rather than estimating single-park monthly ranks.)
To time flagship parks during calmer windows without getting caught behind locked gates, compare our seasonal guides:
- National Parks to Visit in Winter: What’s Open, What’s Closed
- Best Time to Visit Zion National Park (Month by Month)
- Best Time to Visit Yellowstone National Park
- Easy National Parks for Seniors (scenic-drive parks that work well on mid-week shoulder dates)
How to read visit counts: what the NPS actually measures
Annual visit rankings do not always equal trail congestion. Before choosing a park off raw numbers, keep four official NPS counting rules in mind (NPS Visitor Use Statistics Dashboard; NPS Statistical Abstract: 2025, pp. iv & 49):
- Recreation visits vs. non-recreation traffic: The NPS excludes commuters, commercial delivery trucks, and through-highway traffic (non-recreation visits totaled an additional 131.6 million in 2025). Still, parks crossed by major toll-free public roads—such as Great Smoky Mountains (U.S. 441), Cuyahoga Valley, and Hot Springs—log millions of short scenic-drive entries alongside trail users.
- Park acreage vs. corridor bottlenecks: Death Valley (3.4 million acres) and Zion (147,000 acres) can feel completely different at 1 million visits because Zion funnels the majority of visitors into a single 6-mile canyon floor.
- Adjacent NPS units split the count: At North Cascades, most roadside overlooks sit inside Ross Lake or Lake Chelan National Recreation Areas (counted separately), making the core National Park count look tiny (46,925). Conversely, Sequoia (1,378,337) and Kings Canyon (779,791) share a boundary and entrance pass while reporting separate visit totals.
- Counter upgrades change year-over-year percentages: When you see Bryce Canyon down −21.2% or Redwood up +93.1% in 2025, crowds did not suddenly vanish or double—the NPS notes in Endnote 5 of the 2025 Statistical Abstract that Bryce Canyon corrected a 2000–2024 shuttle-passenger formula that had overcounted visits by roughly 18–19% per year, while Redwood, New River Gorge, and Cuyahoga Valley deployed updated traffic-counter models.
Plan it: entrance fees, free days, and reservations
Many of the least crowded national parks—including Great Basin, North Cascades, Chiricahua, Channel Islands, Congaree, Voyageurs, and all four remote Alaska parks—charge $0 entrance fees and require zero timed-entry vehicle reservations, though boat ferries and cave tours still sell out:
- Check gate prices and the 24 fee-free parks in National Park Entrance Fees by Park.
- Avoid unintentional crowd spikes by checking National Park Free Entrance Days (fee-free holidays often draw some of the heaviest local traffic of the year).
- Confirm timed-entry corridors, cavern slots, and trail permits in our National Park Reservations Tracker.
- Logging every park you visit? Check off stops on our All 64 National Parks Checklist and grab our printable National Park Trip Planner Kit.
Sources
- https://irma.nps.gov/DataStore/DownloadFile/759491
- https://www.nps.gov/orgs/1207/03-13-26-2025-visitation-statsitics.htm
- https://www.nps.gov/subjects/socialscience/visitor-use-statistics-dashboard.htm
- https://www.nps.gov/aboutus/recent-changes.htm
- https://www.nps.gov/isro/planyourvisit/basicinfo.htm
- https://www.nps.gov/noca/planyourvisit/basicinfo.htm
- https://www.nps.gov/chir/planyourvisit/basicinfo.htm
- https://www.nps.gov/drto/planyourvisit/basicinfo.htm
- https://www.nps.gov/grba/planyourvisit/basicinfo.htm
- https://www.nps.gov/gumo/planyourvisit/basicinfo.htm
- https://www.nps.gov/chis/planyourvisit/basicinfo.htm


